Dashboards turn your test run history into pass rates, failures and durations over time, by suite, branch, environment or release. Insights point out what changed, and reports export to PDF or Excel. Anything TestLookup couldn't measure shows as blank instead of zero.
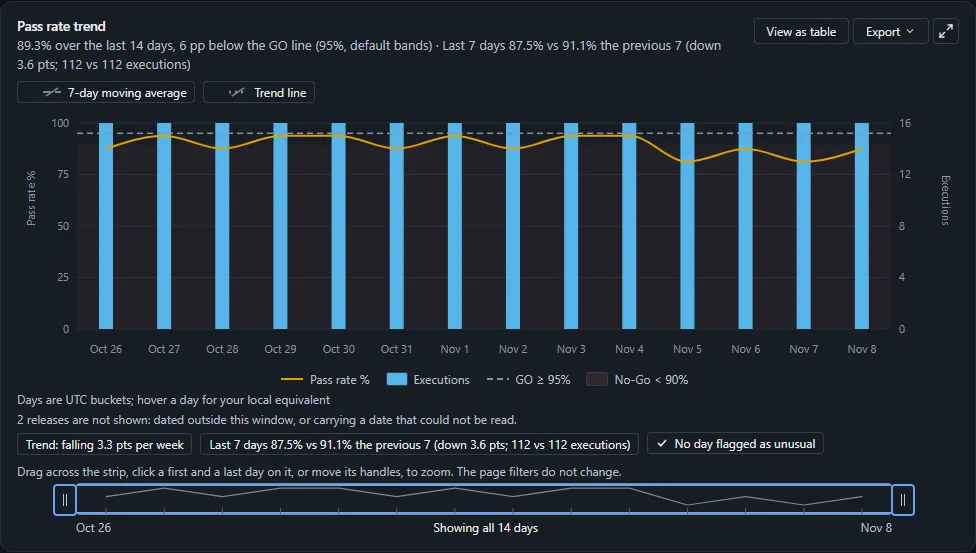
Your GO lineTrends draws pass rate against the GO line and No-Go zone from your project's rules.
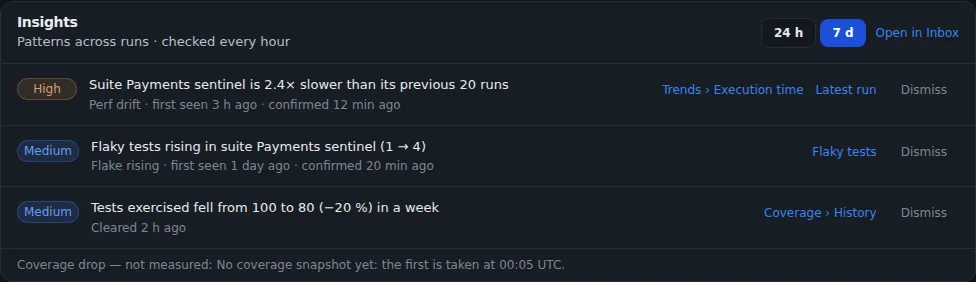
Hourly insightsEvery hour, TestLookup flags slower suites, more flaky tests and fewer tests run, without anyone asking.
Blank, not zeroA figure TestLookup couldn't measure says why it's empty instead of showing zero.
Project health on one screen
Home
Start from the release banner
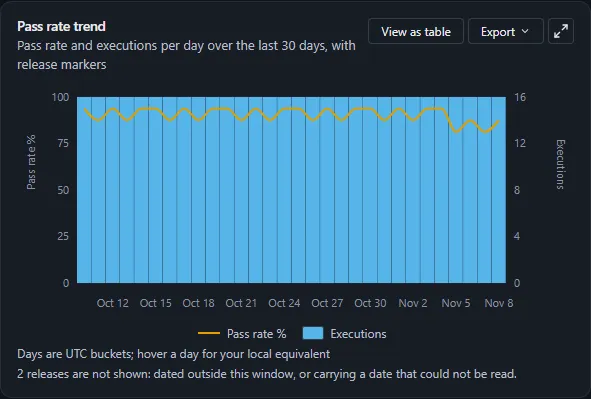
The Home page opens with a release-readiness banner that names the rules behind it and any hard limit that forced a No-Go. Below it, five tiles show test executions, average pass rate, new failures in the last 24 hours, flaky tests and active defects. Each tile opens the page behind it.
A pass rate trend with release markers, a breakdown by result and the top failing tests
Every chart offers View as table, and exports as a PNG or SVG image or a CSV file
A project with no runs yet shows the first-run guide instead
Sample data Pass rate and executions for each of the last 30 days
Trends
Track pass rate against your GO line
Trends draws the pass rate of each test execution against the GO line from your project's rules, with the No-Go zone shaded below. A sentence above the chart says how far the period sits from the line, and points out any days with no runs. Execution time has its own view: total time against test time, each suite's median and 95th-percentile time, and the slowest tests.
Download the page as a PDF for its time period, suite and release
QA leads can send it as a one-off email to up to 10 recipients
In the PDF, a day with no runs shows as a gap instead of 0%
Sample data Trends against your GO line
Split the numbers and see what changed
Explorer
Split one measure into small side-by-side charts
Explorer draws one of 16 measures over 7 to 90 days, by day or by week. Split it into lines or up to 12 panels, by suite, release, branch, environment, status, failure kind or how results arrived. Put the panels on one shared scale to compare size, or on separate scales to compare shape.
The page address holds the whole setup, so a link reopens it
The Views menu saves a setup with its time period and release, for each project
Options the data can't support are turned down, with the reason
Get chart data from the command linebash · TestLookup CLI
This gives the pass rate per day, one line per suite, as a CSV file for your own tools.
Insights and expected runs
Get told what changed across runs
Every hour, four rules check saved results for slower suites, more flaky tests, fewer tests run and AI spending near its warning level. Findings appear on the Home page's Insights card and in the Inbox, without any AI call or notification. Say when runs are expected, and TestLookup flags a missed nightly run so it doesn't go unnoticed.
A rule that can't measure something says why, instead of showing a check mark
TestLookup checks expected runs every 15 minutes, and daylight saving clock changes don't cause false alarms
A missed run notifies only the people who opted in
Trends and Coverage then show how many expected runs arrived
Sample data Insights flag what changed across runs
Reports to share and compare
Summary report
Export a summary for any time period
Reports › Summary covers one project over 1, 7, 14, 30 or 90 days. It shows total tests, the share that passed, failed or broke, flaky tests, a breakdown by suite, the trend and the top 10 failing tests. Count each suite's latest run or every unique test in the period, limit it to one release, and export it as PDF or Excel.
You can also export one HTML analysis report of the last day or week, which works offline
Large exports run in the background, and you can download them for 7 days
TestLookup checks access again when the file is made and when it's downloaded
With a release filter, the flaky count still covers the whole project. This is intended.
Compare
Compare any two runs
Runs › Compare shows the differences between a suite's two latest runs, or any two runs you find by build, branch, continuous integration (CI) job or commit. It starts with pass rate, failed tests, new failures and duration for each side, then puts the two AI analyses side by side. The page address holds the comparison, so you can share it.
Filter to new failures, regressions, still failing, duration spikes or fixed tests
Paste a run ID to compare runs from any release
Runs from two different projects can't be compared
What each number counts
Home and Runs count every test execution, while Coverage and the summary count unique tests. That's why their totals differ.
Blank instead of zero
When TestLookup can't measure something, it shows a blank with the reason. A missing time reads not reported, and an empty panel means no matching data for that filter. An unknown escape rate reads not measured.
Coverage means tests that ran
Coverage counts the unique tests, suites and executions in the reports you send, and how often runs arrive. It isn't line or branch coverage of your code. TestLookup only sees your test reports.
Value metrics wait for enough data
Reports › Value estimates the engineer-hours saved by grouped failures, quarantined tests and duplicate failures folded into one group. It stays blank, with the reason, until a project's runs cover 14 days and the last 30 days give an estimate above zero.
Example with made-up data. Nothing on this page contacts a server.
Example: why two pass rates differ
The same 100 sample results give two pass rates: 70.0% when skipped results stay in the total, and 77.8% when they are left out. When you compare pass rates, check which results each one counts.
Pass rate, skipped results counted
70.0%
All 100 sample results, skipped included
Formula
Numerator 70 ÷ denominator 100 × 100
Pass rate, skipped results left out
77.8%
The 90 results that ran; 10 skipped left out
Formula
Numerator 70 ÷ denominator 90 × 100
Sample results by outcome
Outcome
Count
✓Passed
70
×Failed
15
!Broken
5
–Skipped
10
Total
100
Report review
◷Pending review
No one has reviewed this sample report. Reviewing a report is a separate step from the release verdict.
Release verdict
?Not evaluated
This sample has too little release evidence for a verdict, so none is given.
Evidence
Fixture sample-run-card · Made-up sample data bundled with this website
run: sample-run-001
source: sample data bundled with this website
network requests: none
use: example only