Test runs from your continuous integration (CI) system arrive linked to their pull request, CI job and code changes. TestLookup finds the build where each new failure started, and asks a person before it sets a test aside or files a bug. If TestLookup can't answer, your pipeline check fails instead of passing.
Sample data TestLookup's analysis runs for one test run, with retry
Five CI systems detectedRuns from GitHub Actions, GitLab CI, Jenkins, Azure DevOps and CircleCI link back to their pull request and job.
Checks that fail safelyIf TestLookup can't be reached, the build fails with code 2 instead of passing by mistake.
People approve the changesA QA lead approves every quarantine, which sets a flaky test aside. Critical or high defects wait for approval too.
Every CI run knows its pipeline
The command-line tool and code libraries read your CI system's own settings, so each run arrives already linked to its pull request and job.
CI details
Pull request and CI job, detected
When results come from a CI job, the command-line tool and code libraries add details about where they came from. That means the CI system, repository, pull or merge request number, who started the job, and a link back to it. They read the standard settings of GitHub Actions, GitLab CI, Jenkins, Azure DevOps and CircleCI.
Values you pass yourself always win over what's detected
The CI run link keeps two jobs with the same build label apart
The same details are also used for pull request comments and merge request notes
Outside CI, the tools send none of these details
Code changes
The code changes behind every run
The command-line tool and the Python library read the run's commits, the saved changes in Git, from your local copy of the code. For each commit, they send its ID, author name, first message line, date and the names of changed files. They work without a token or network call, and they never send the code changes themselves or file contents.
Up to 100 commits per run
With a shallow clone, a copy with little history, the tool sends only the latest commit
Starting point: your setting first, then your CI system's own, then where your branch split off
On CircleCI, set the pipeline's starting point yourself
If Git has a problem, the commits are left out and your test run continues as normal
The JavaScript, Java and Go libraries don't send commits
Pull request feedback
Results posted back to the pull request
Off by defaultTurn off offline mode, turn on the GitHub checks or GitLab setting, and add a token.
With the GitHub integration, a run that has a full commit ID posts a check on GitHub, with notes on up to 50 tests. A run linked to a pull request, a proposed change waiting for review, keeps one comment up to date. It lists newly failed, known flaky and fixed tests, and GitLab gets the same note on the merge request, plus a commit status.
If every failure is known flaky or quarantined, the check ends as neutral instead of failed
Re-runs update the same comment
TestLookup posts to GitLab itself, so your CI needs no GitLab token
Comment modes: off, failures only or always. Failures only is the default.
Find the change that broke it
Find the last build where each new failing test passed. Then read the code changes, the setup changes and the tests most likely affected.
Last pass, first failure
From last pass to first failure
Bisect from last green, a button in the status banner on Runs, opens the latest failed run. It shows the first new failure, with the build where that test last passed and the build where it first failed. TestLookup looks back up to 200 runs on the run's branch.
With GitHub or GitLab connected and offline mode off, the commits between those builds are ranked as likely causes
If both builds have the same commit, the page says no code change explains it
If the branch never passed, TestLookup looks at main or master instead
Every other new failure in the run has its own Narrow button
It only reads history. It writes and re-runs nothing.
Setup changes
What changed besides the code
The Configuration drift card lists what differs from the build you compare against. It covers dependency lock files, language versions, container image IDs, the environment label, allowed environment settings and the branch. The Python library and the command-line tool record these details on your machine and hide anything that looks like a token.
Uploads from the web page, saved files and the JavaScript, Java and Go libraries don't include these details
A run without them reads not recorded, instead of showing no changes
Lock files are only fingerprinted, and their contents stay on your machine
Add Java, Node or image versions yourself with a setting or a command-line option
These details are never given to the AI analysis
Test impact
Likely affected tests, with the reason
Likely affected tests ranks a run's tests by how well their names and locations match the changed files. Once the project has enough commit history, past failures when those files changed count too. Each row names the matching files and how often the test failed when they changed.
It only advises, and never picks, skips, quarantines or blocks a test
With little history, the card ranks by matching file paths and says so
Flaky tests get no extra weight for failing alongside past changes
With no commits to read, the card says why instead of showing an empty list
It reads the run's commits and fetches nothing else
Fail the build only on real failures
Two commands turn TestLookup's answer into an exit code, the number a command ends with. If TestLookup can't answer, both make the check fail instead of pass.
CI verdict
Block only on real failures
After the upload, the ci-verdict command compares the run's failed tests with the tests your project has set aside. It ends with 0 when there are no real failures, and 1 when at least one failure isn't quarantined. It ends with 2 when TestLookup can't answer or the run takes too long to finish.
A strict option blocks on any failure, including quarantined ones
Another option turns TestLookup errors into a pass, with a warning
A time limit lets the check wait for a run that's still being processed
With quarantine turned off, every failure counts as real
You don't need to change your test code
Upload, then check, in GitLab CIyaml · TestLookup user guide
Set TESTLOOKUP_URL, TESTLOOKUP_API_KEY and TESTLOOKUP_PROJECT, the project's ID, as masked CI/CD variables. Use an image with Python, Git and jq. Code 0 passes, 1 blocks on a real failure, and 2 means TestLookup couldn't answer, so the job fails. Details: the options above are --strict, --fail-open and --timeout-seconds.
Release gate
Fail the deploy on NO-GO
The release gate command reads a release's saved verdict. It ends with 0 for GO, 1 for NO-GO and 3 when there's no verdict yet. A release isn't evaluated again when new runs arrive, so the command can record a fresh verdict in the same step.
Network, permission and release-name errors end with 2, so the deploy stops instead of passing
Recording a fresh verdict needs QA lead rights or a project API key
A JSON option prints the release ID and the full verdict details
Details: the command is testlookup release gate. Add --evaluate for a fresh verdict, or --json for the full output.
Analysis you can watch and retry
TestLookup processes each upload in the background, then runs its own analysis steps on it, separately from your CI pipeline. Follow each run as it arrives, and retry or stop its analysis.
Processing uploads
Accepted at once, processed in the background
TestLookup accepts an upload straight away (HTTP 202). Background workers then read the file, remove duplicates, finish the run and analyze it, and the run appears on Runs a few seconds later. A file upload returns a task ID, and its status shows each stage: pending, parsing, ingesting (saving the results), then succeeded or failed.
Accepted doesn't mean saved yet, so check the upload status
Report files up to 50 MiB, or a ZIP of reports
Upload status is kept for 24 hours
Administrators can retry failed uploads from the holding area for failed jobs, called the dead-letter queue
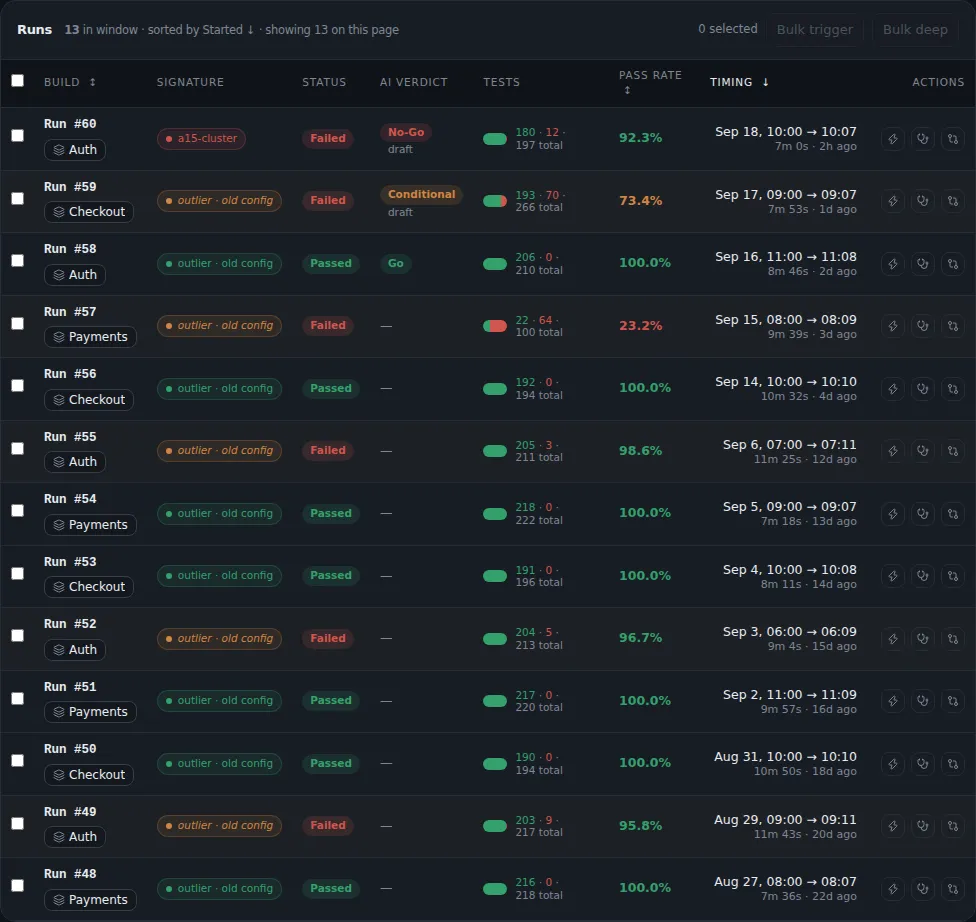
Sample data Every run with its status, AI verdict and pass rate
Analysis runs
Retry from the last finished step
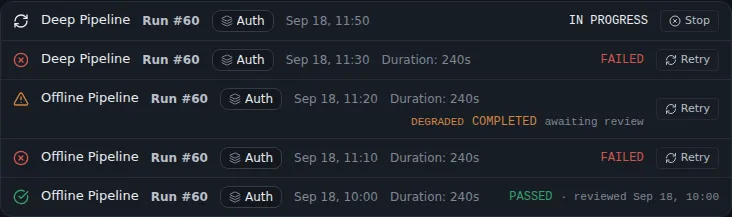
Analysis starts on its own once a run is complete. The Pipeline runs page lists each analysis with its steps, timing and status, such as retrying or Degraded, which means some steps failed and used a simpler fallback. Retry continues a failed analysis and keeps its finished steps, or starts afresh if the analysis settings changed.
Stop ends a running analysis when its current step finishes
On Runs, Bulk trigger and Deep all failed send many runs for analysis as one tracked job
A run that's already waiting or running doesn't start twice
Automatic retries: 5 attempts, with waits that grow from 30 seconds
Retries and stops are recorded in the project's activity
Sample data Analyzing many runs at once
Live execution
Watch a suite while it runs
The Live Execution page, under Runs › Live, lists each live run with its build, suite, passes and failures. Beside it, a Pipeline events feed shows the latest 200 events, over a live connection that falls back to regular checks. When a run completes, TestLookup finishes it and starts its analysis, just as for an uploaded report.
Pass rate is checked against your project's GO and No-Go levels
If a test runner crashes partway, TestLookup closes the run instead of leaving it in progress
Live updates need one project selected. All Projects checks for updates regularly instead.
Send results by saving files
Some CI jobs can save files to TestLookup's built-in storage but can't use its API. They can still send Allure or TestNG results: save them in a new folder for the build, then add a marker file named upload_complete.json last. Within about a minute, TestLookup finds the folder and imports it, with no notifications to set up. Details: use <project>/runs/<build>/allure/*-result.json or <project>/runs/<build>/testng/*.xml, and send other formats with an upload. This is on by default and runs in the scheduler service, which the smaller dev-lite setup leaves out.
Know when the nightly run is missing
Expected runs lets you say when a suite should arrive: by weekdays, time, time zone and grace period, or with a cron schedule. A check every 15 minutes records each missed slot, Trends shows Expected runs missed, and you can opt in to a notification. TestLookup only watches, and it starts or stops nothing in your CI.
Automation that waits for a person
TestLookup proposes and notifies. A person decides anything that quarantines a test, files a defect or opens an epic.
Webhooks
Signed messages to your own systems
Off by defaultTurn off offline mode. An upgraded installation also needs the webhooks setting turned on.
A webhook is an automatic message TestLookup sends to your own web address when something happens. Each project can subscribe to six events: run completed, defect promoted, defect requested, release decided, test quarantined and quota exceeded. With a secret set, each message includes an HMAC-SHA256 signature, which proves it came from TestLookup unchanged.
Timeouts and server errors are retried with growing waits, then set aside, and you can resend any failed message
Waits grow from 30 seconds to 8 minutes, with 5 retries by default and up to 10
By default, 10 failures in a row pause a subscription and alert QA leads
Recent deliveries shows the last 20 attempts
QA leads create and test subscriptions, and resend deliveries
Approvals
Quarantine and defects wait for a QA lead
TestLookup proposes quarantine when a test flips between pass and fail past the project's limit, 20% over 10 runs by default. A QA lead approves or rejects each proposal, and a quarantined test still runs but doesn't count toward the release check or the CI verdict. This lasts for the quarantine period, 14 days by default.
Promoted defects that are critical, high, low-confidence or headed for Jira also wait for approval
Proposals nobody decides expire after 7 days
Every quarantine change is recorded in the audit log
Automatic release from quarantine after 20 passes stays off until you turn it on
In offline mode, an approved defect stays in TestLookup and isn't filed in Jira
Repeat failure groups
Turn a repeat failure group into a Jira epic
Opt-inA QA lead turns on epic suggestions in Edit Project, and Jira must be reachable.
When a group of flaky tests has failed together in 3 or more runs, QA engineers and above see Create epic for this cluster. It previews a Jira epic, a large piece of work that groups issues, and files it only when the person clicks Create. An epic never counts as a defect or affects the release check.
No scheduled job, agent or webhook files an epic
The link stays through nightly regrouping, as long as the same tests are in the group
If Jira can't be reached or has no Epic type, the button says why
TestLookup files only one epic per group
Alerts when something changes
By default, each project alerts only when a test's state changes, such as newly failing, recovered, newly flaky or quarantined, and per-run messages stay off. A recorded move to NO-GO sends Quality gate failed once per decision. Team channels send a failing test's alerts to the team that owns it.
Summaries on your schedule
Digests are summaries sent daily, weekly, or per run, release or suite, to email, Slack or Microsoft Teams. A daily or weekly digest can follow a saved view, and the email can attach a standalone HTML report. Daily, weekly and per-release digests show the release's saved verdict, and the weekly retro digest stays off until an administrator turns it on.
Learn more
Guides for setting up a CI job, sending results and connecting your tools.